Node-RED Data Visualization
Node-RED Data Visualization
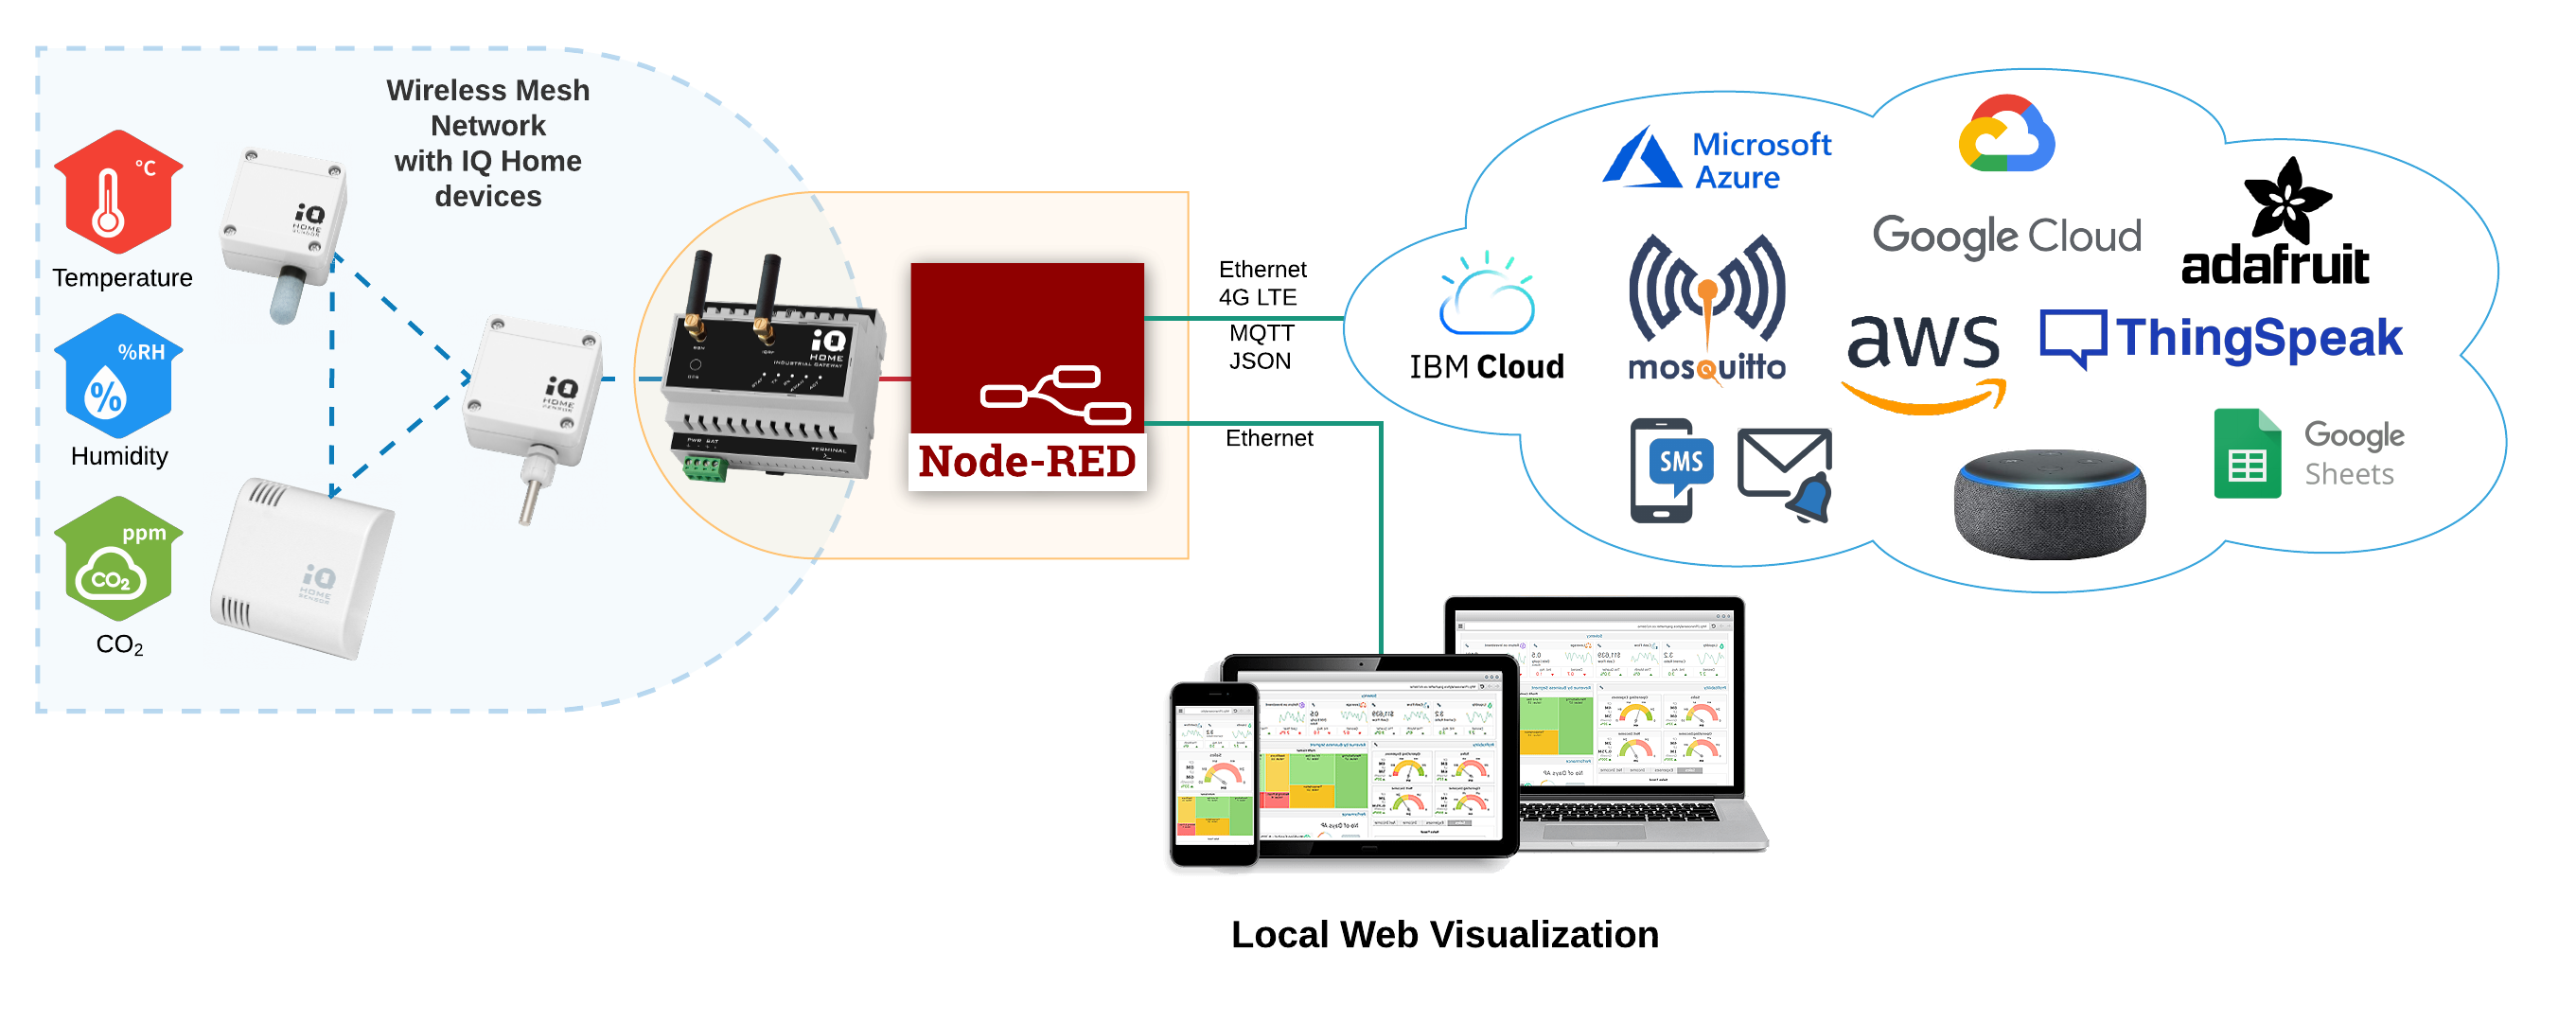
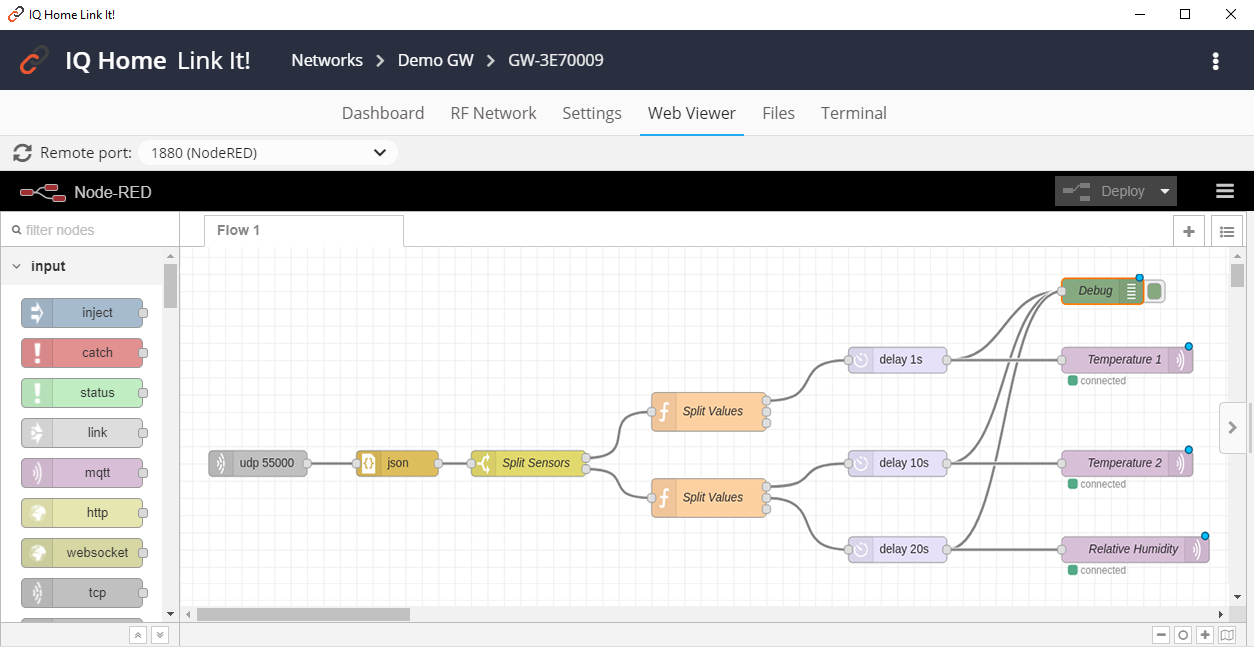
The IQ Home sensor family and gateways support the Node-RED programming interface. The service is hosted on the gateways, so it can be remotely accessed from anywhere. You can securely develop and debug Node-RED flows remotely through the LinkIt! application. It provides an easy solution for automation with high customizability and low time to market. Node-RED can interface with almost any web API, for example, Adafruit, Thingspeak, and Google Spreadsheets for data visualization, or Amazon Alexa and Google Assistant for user interactions.
What is Node-RED?
Node-RED is a visual programming tool used for wiring together hardware devices, APIs, and online services. It uses a flow-based programming interface, which can be accessed through any browser. It uses Node.js as a runtime environment, which makes it ideal for event-driven applications. Its visual programming style makes it possible for the most commonly used tasks to be easily automated without writing any code.
Node-RED Dashboard
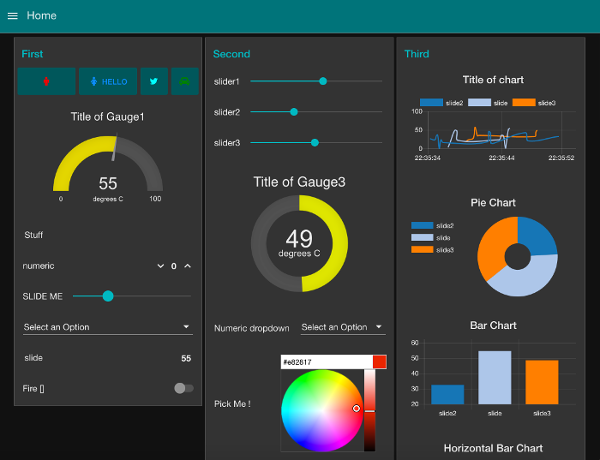
Node-RED has a free downloadable plug-in called Node-RED Dashboard. This plugin opens up a new level of web visualization and dashboard customization. The plugin gives the user a clean and easy-to-use platform of which the visualization features can be tailored to each and every individual's liking. The platform is hosted on the IQ Home gateway itself, so it is available across the network. With the plugin, the sensor data can be displayed as a line, bar, pie chart or use gauges.